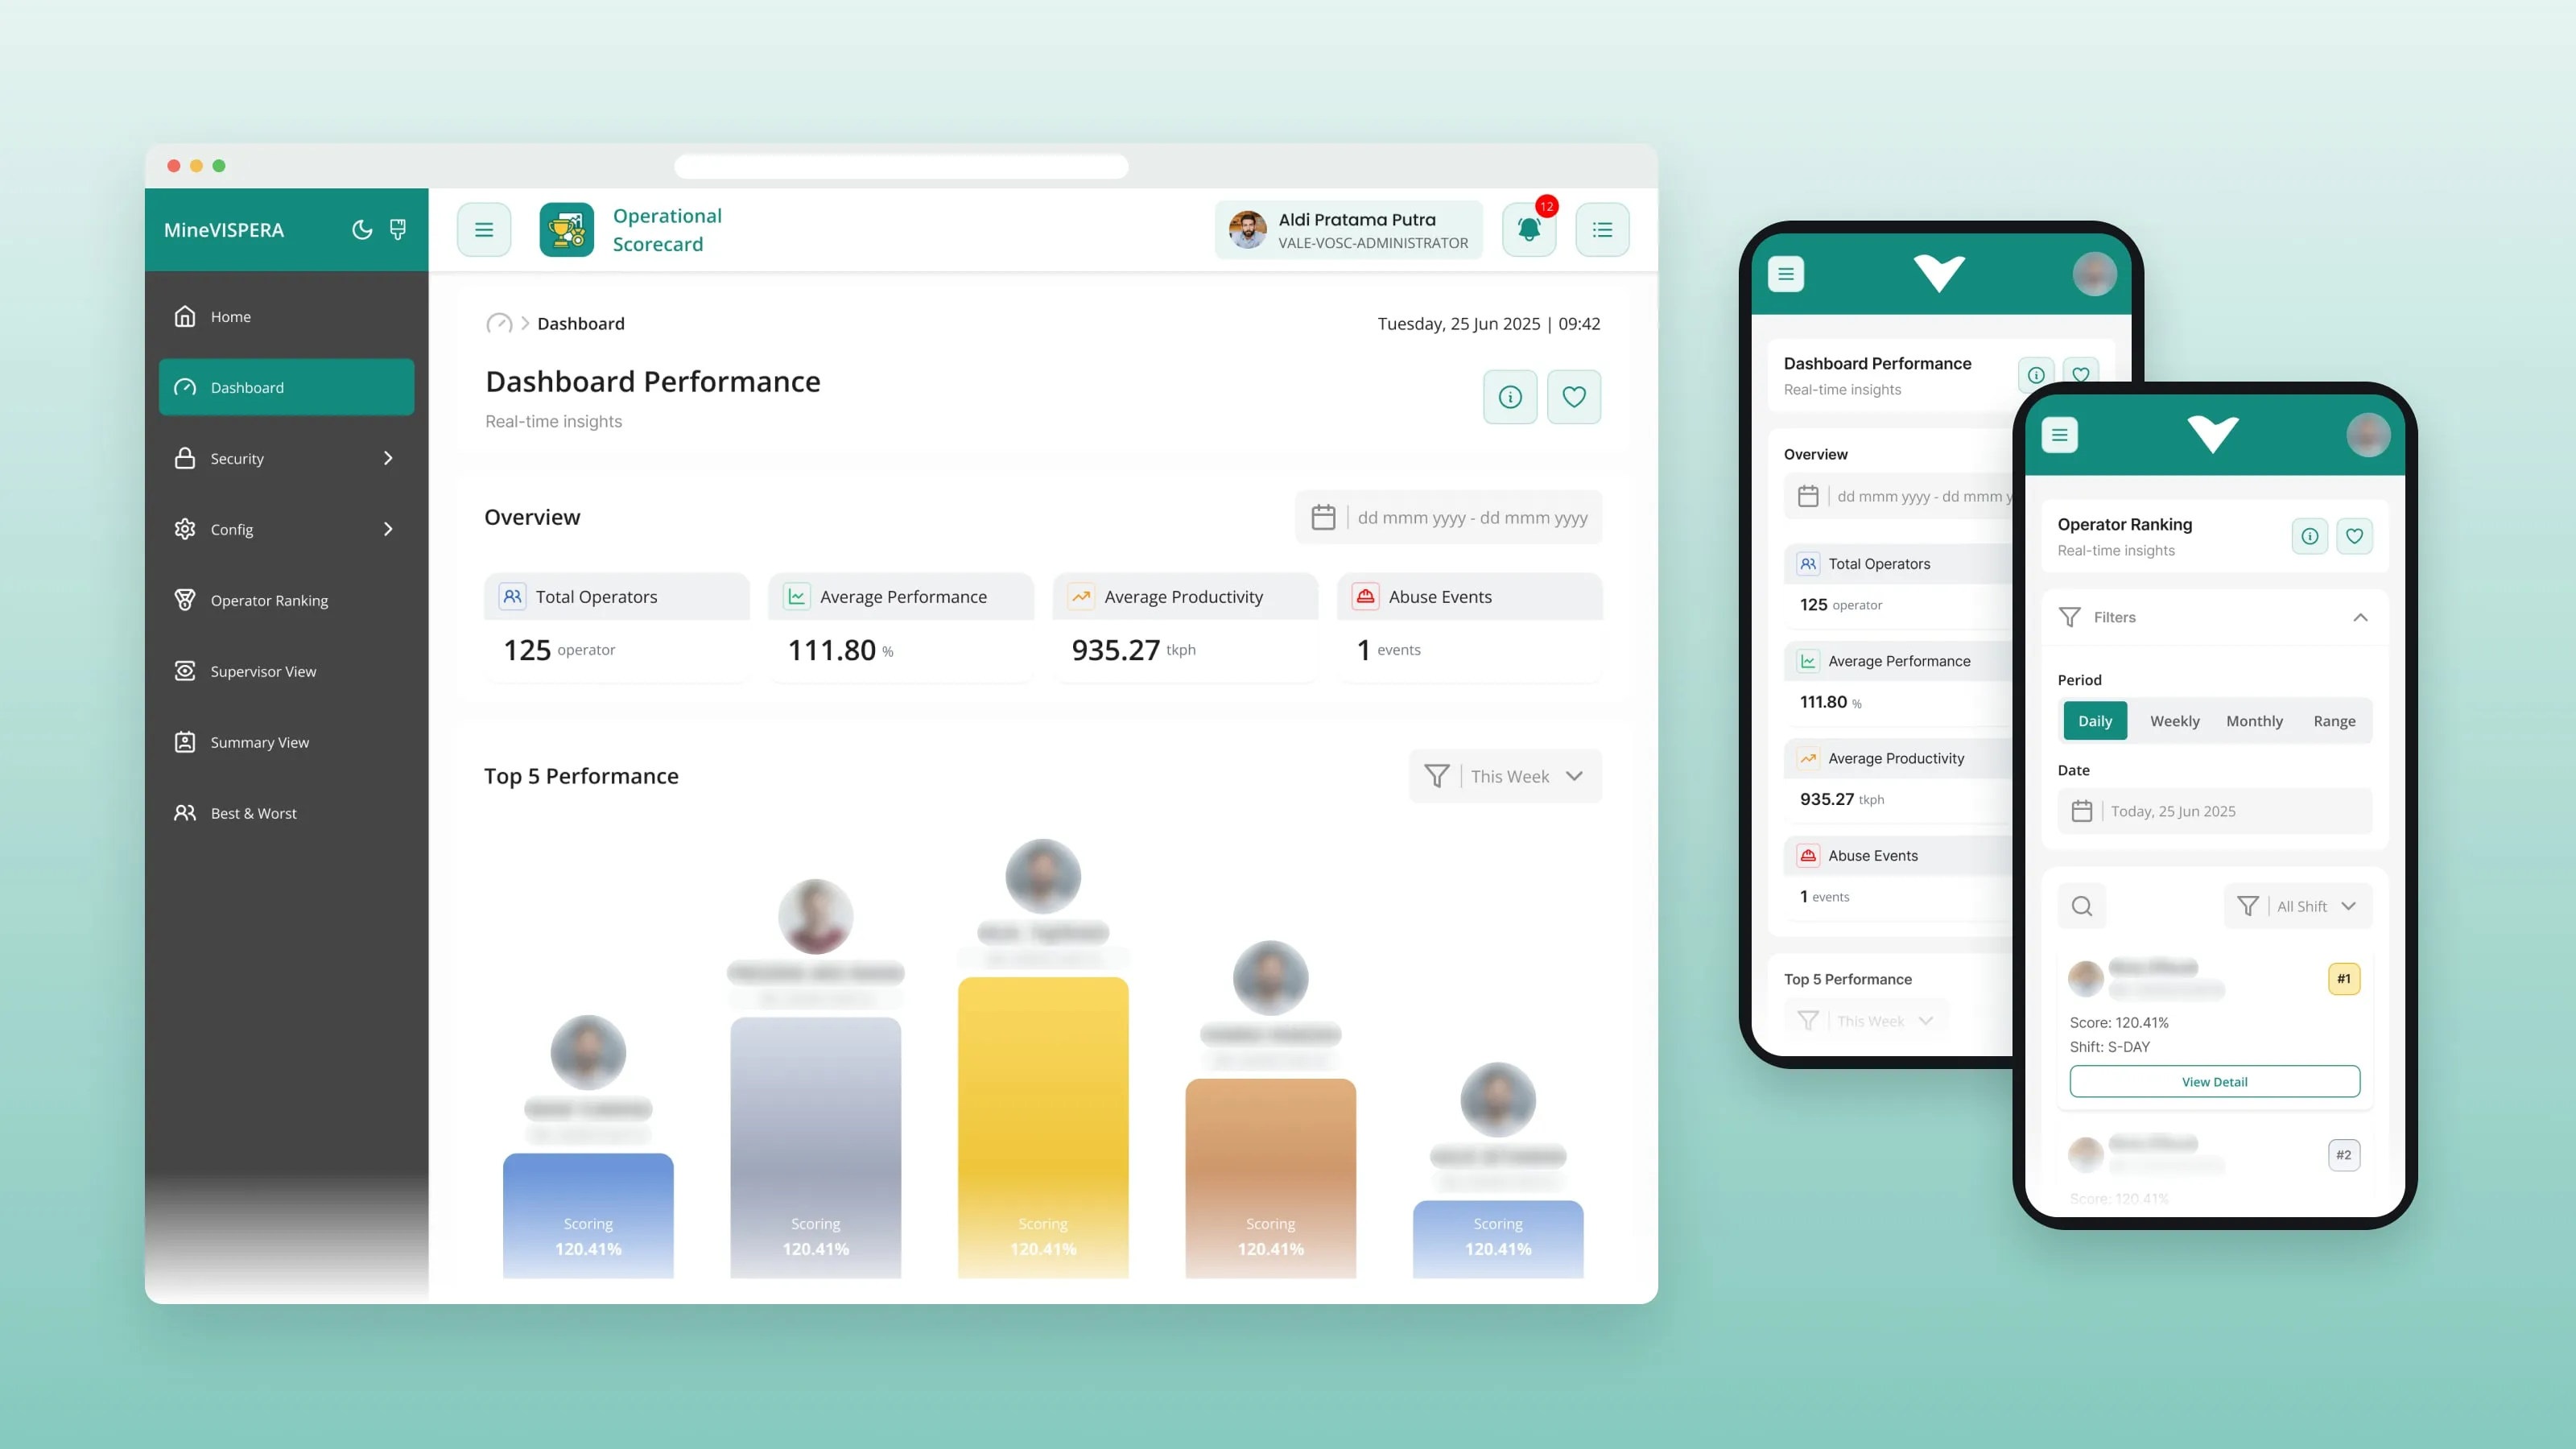
01 / Context
MineVISPERA is a web app that mining companies use to manage operator training, track performance and analyze operational data.
It has several modules, including the Default Module, Operation Scorecard and Mine Mentor. Over time, the interface became dense. The task was to redesign it without changing the business logic or the data structure behind it.
02 / Problem
The data was all needed, but it was hard to read.
- Dense screens
- Important data was hard to scan.
- Navigation
- Moving between modules was not always clear.
- Inconsistent patterns
- Similar actions looked different in different places.
- Tables and dashboards
- They held a lot of data with little visual hierarchy.
- Desktop only
- The interface was built mainly for desktop, so it was hard to use on smaller screens.
- Too much at once
- Some workflows asked users to take in too much information in one step.
And one fixed rule: the business logic, the backend and the operational workflows had to stay the same.
03 / My role
I was the UI/UX designer, hired as a freelancer.
- Redesign
- I redesigned 3 core modules, about 100 screens, within 1 month.
- Responsive UI
- I designed the UI for desktop and mobile.
- Prototypes
- I built interactive Figma prototypes for client reviews and sign-off.
- UX copy
- I wrote the interface copy.
- Handoff
- I delivered the full handoff package for the developers.
04 / Process
Read the product, then sort what users see.
- 01
Read the existing product first.
I went through the existing screens, navigation, tables, dashboards, forms and flows, and noted where the interface made things harder than they needed to be.
- 02
Sort what users see.
I split every screen into three layers: the information users need to understand the current state, the supporting details, and the actions for the next step.
- 03
Design the platform as one system.
I set up shared patterns first, then applied them across the three modules.
- 04
Prototype the tricky parts.
Dashboards, card and table views, enrollment flows and hierarchical data were prototyped in Figma, so the client could review how they behave, not just how they look.
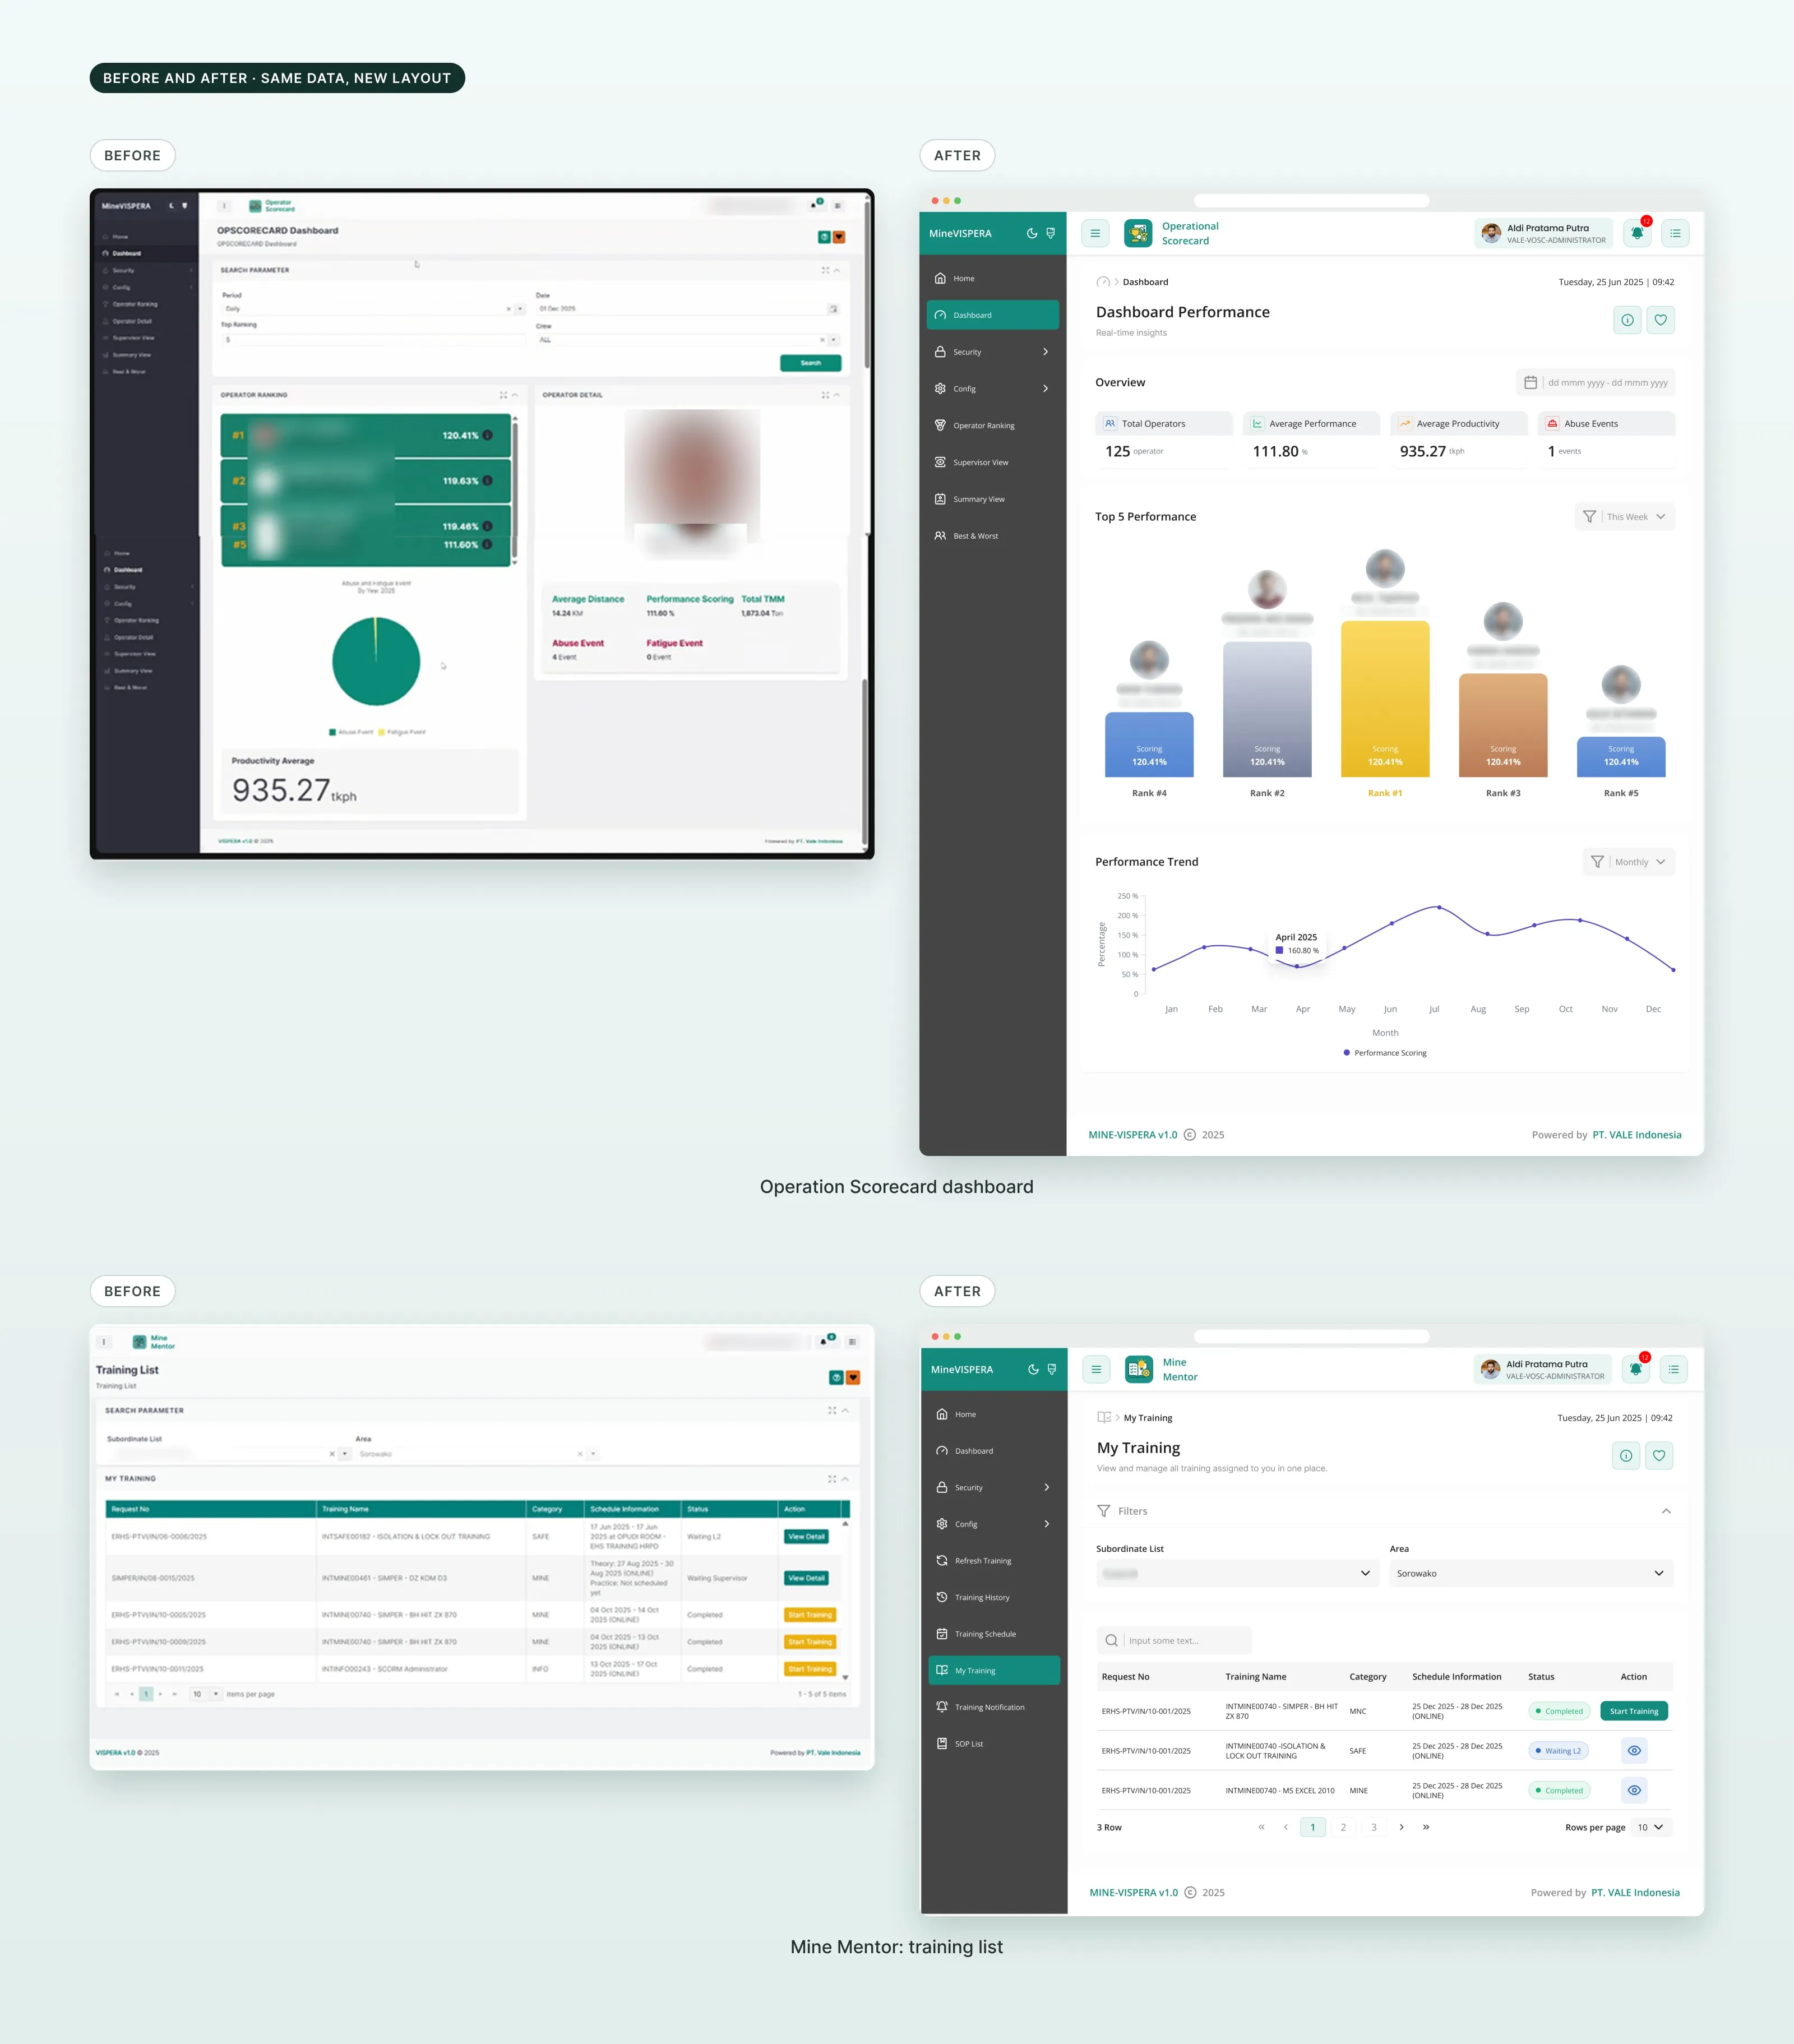
05 / Solution
Clearer hierarchy, three modules, one system.
Clearer hierarchy on every screen.
Primary information comes first, supporting details second, and actions are easy to find. Dashboards, tables, cards and detail views became easier to scan.
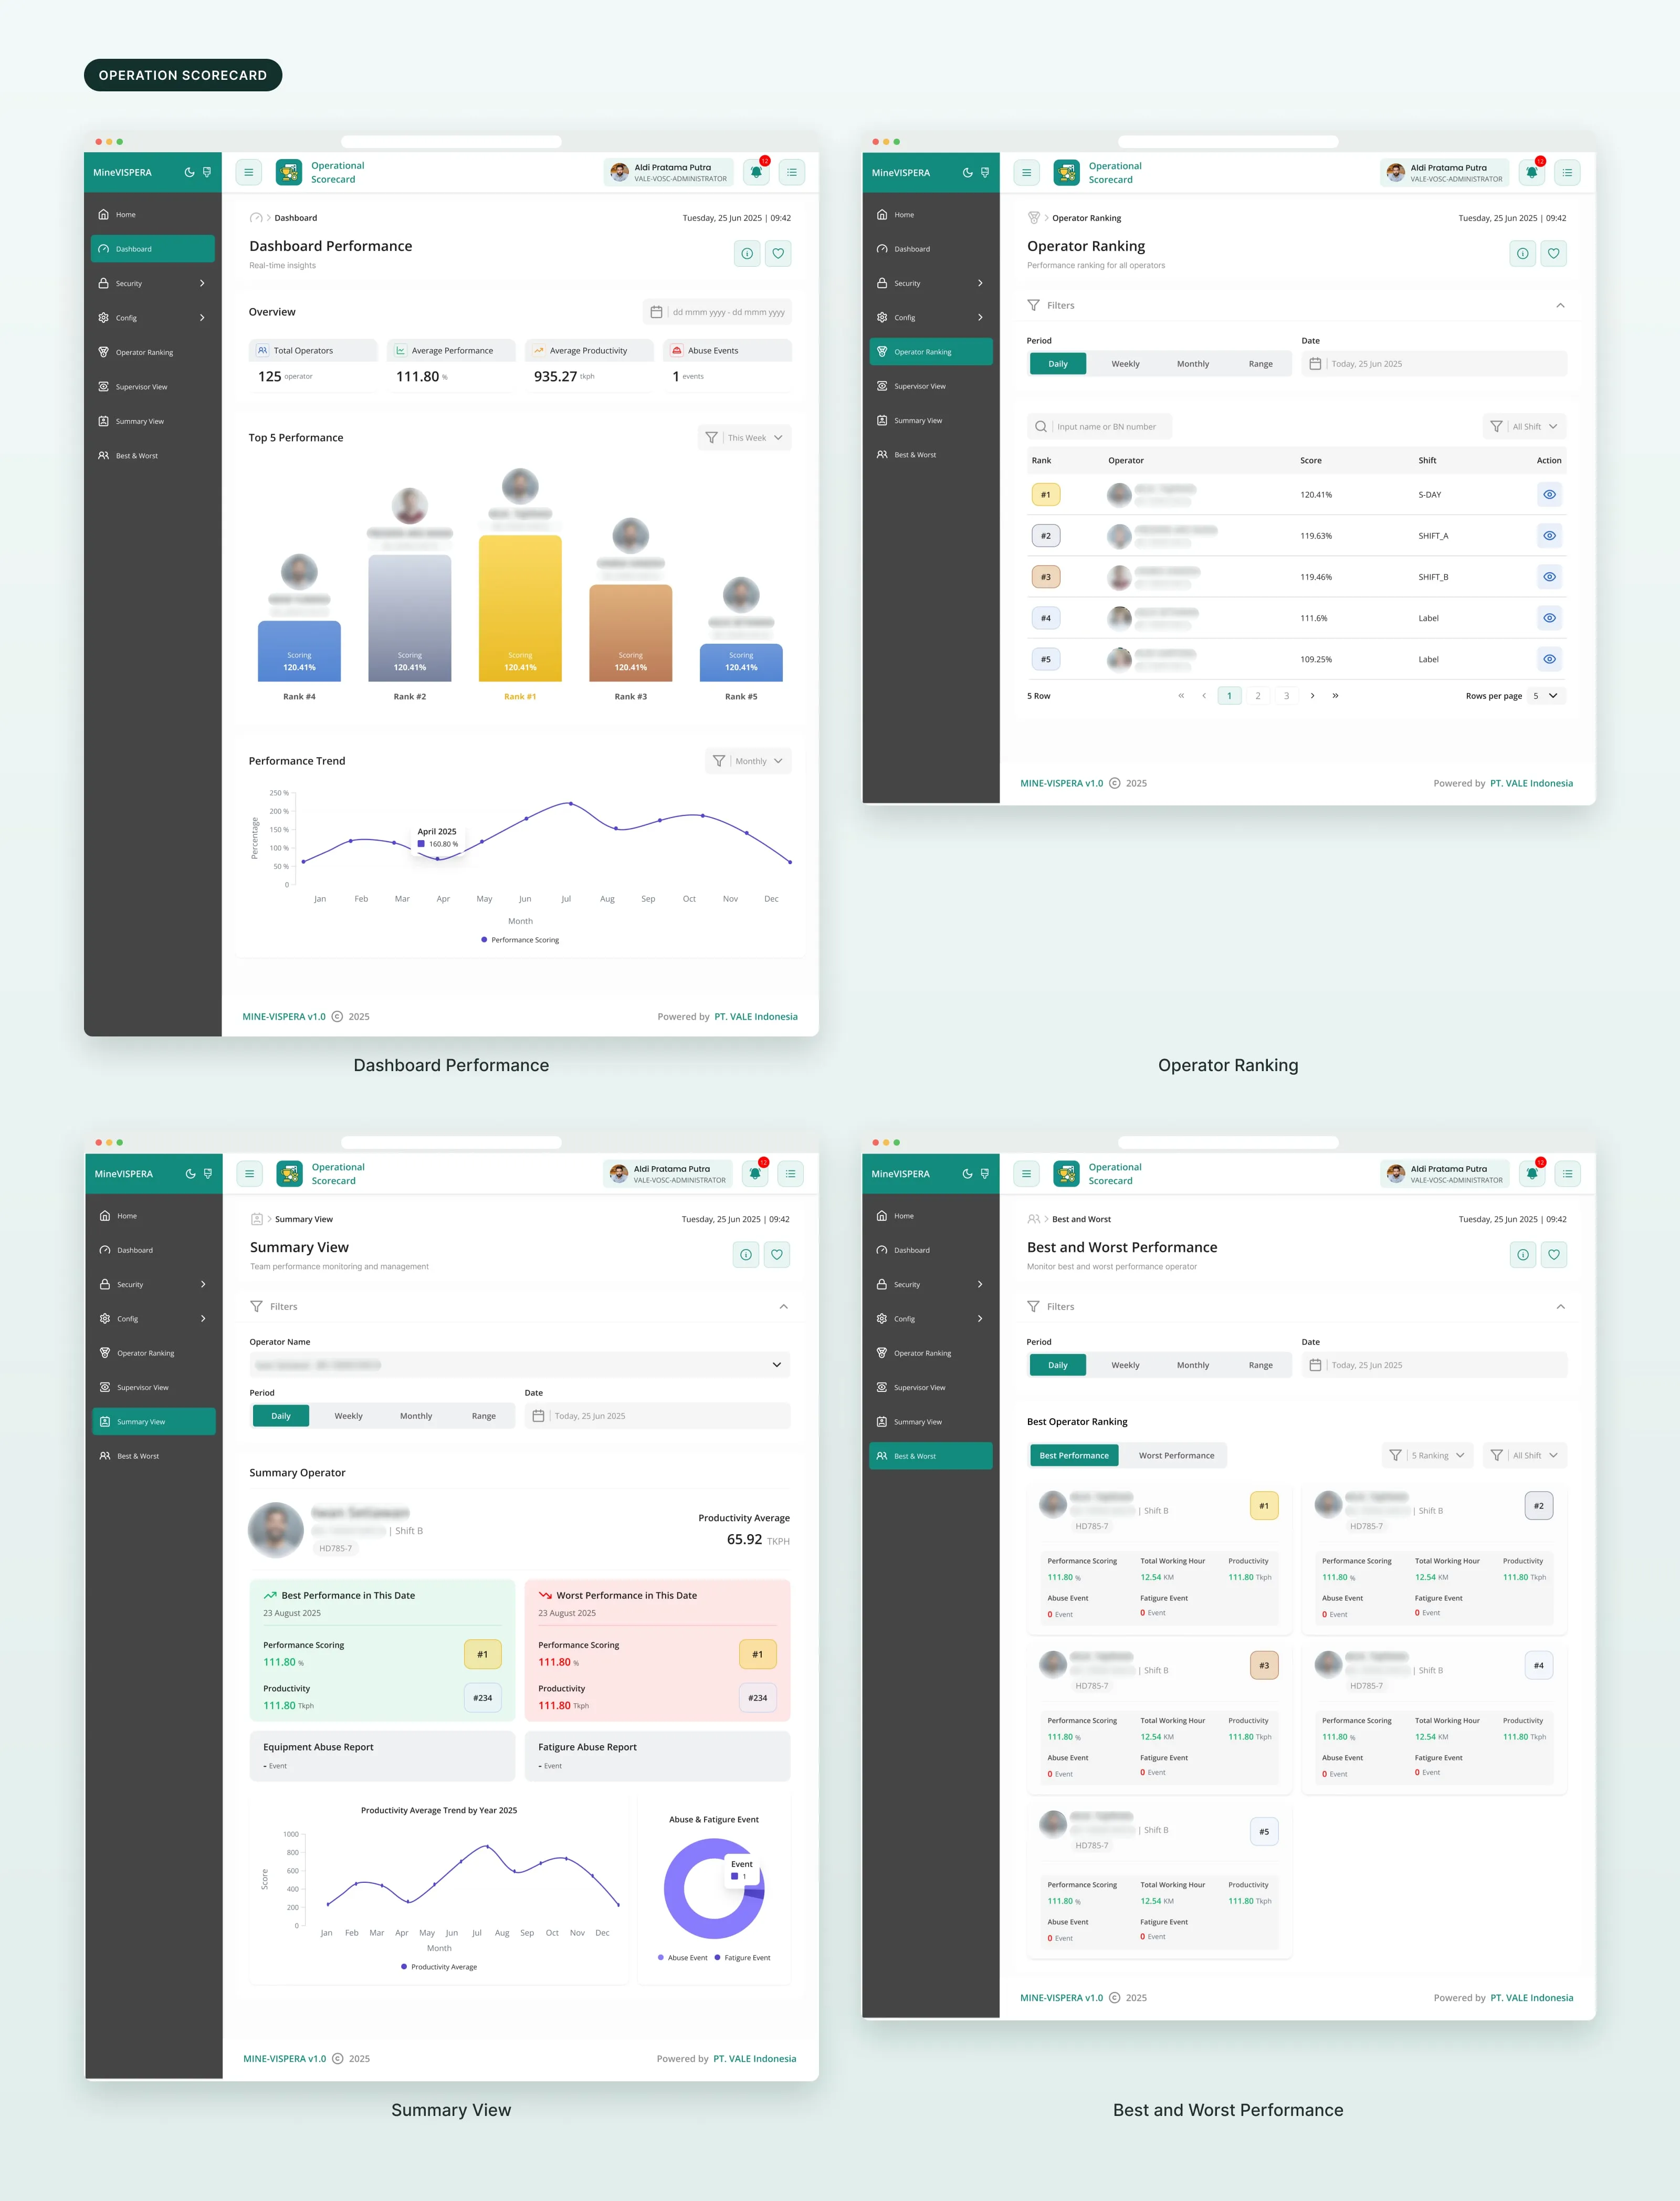
Operation Scorecard.
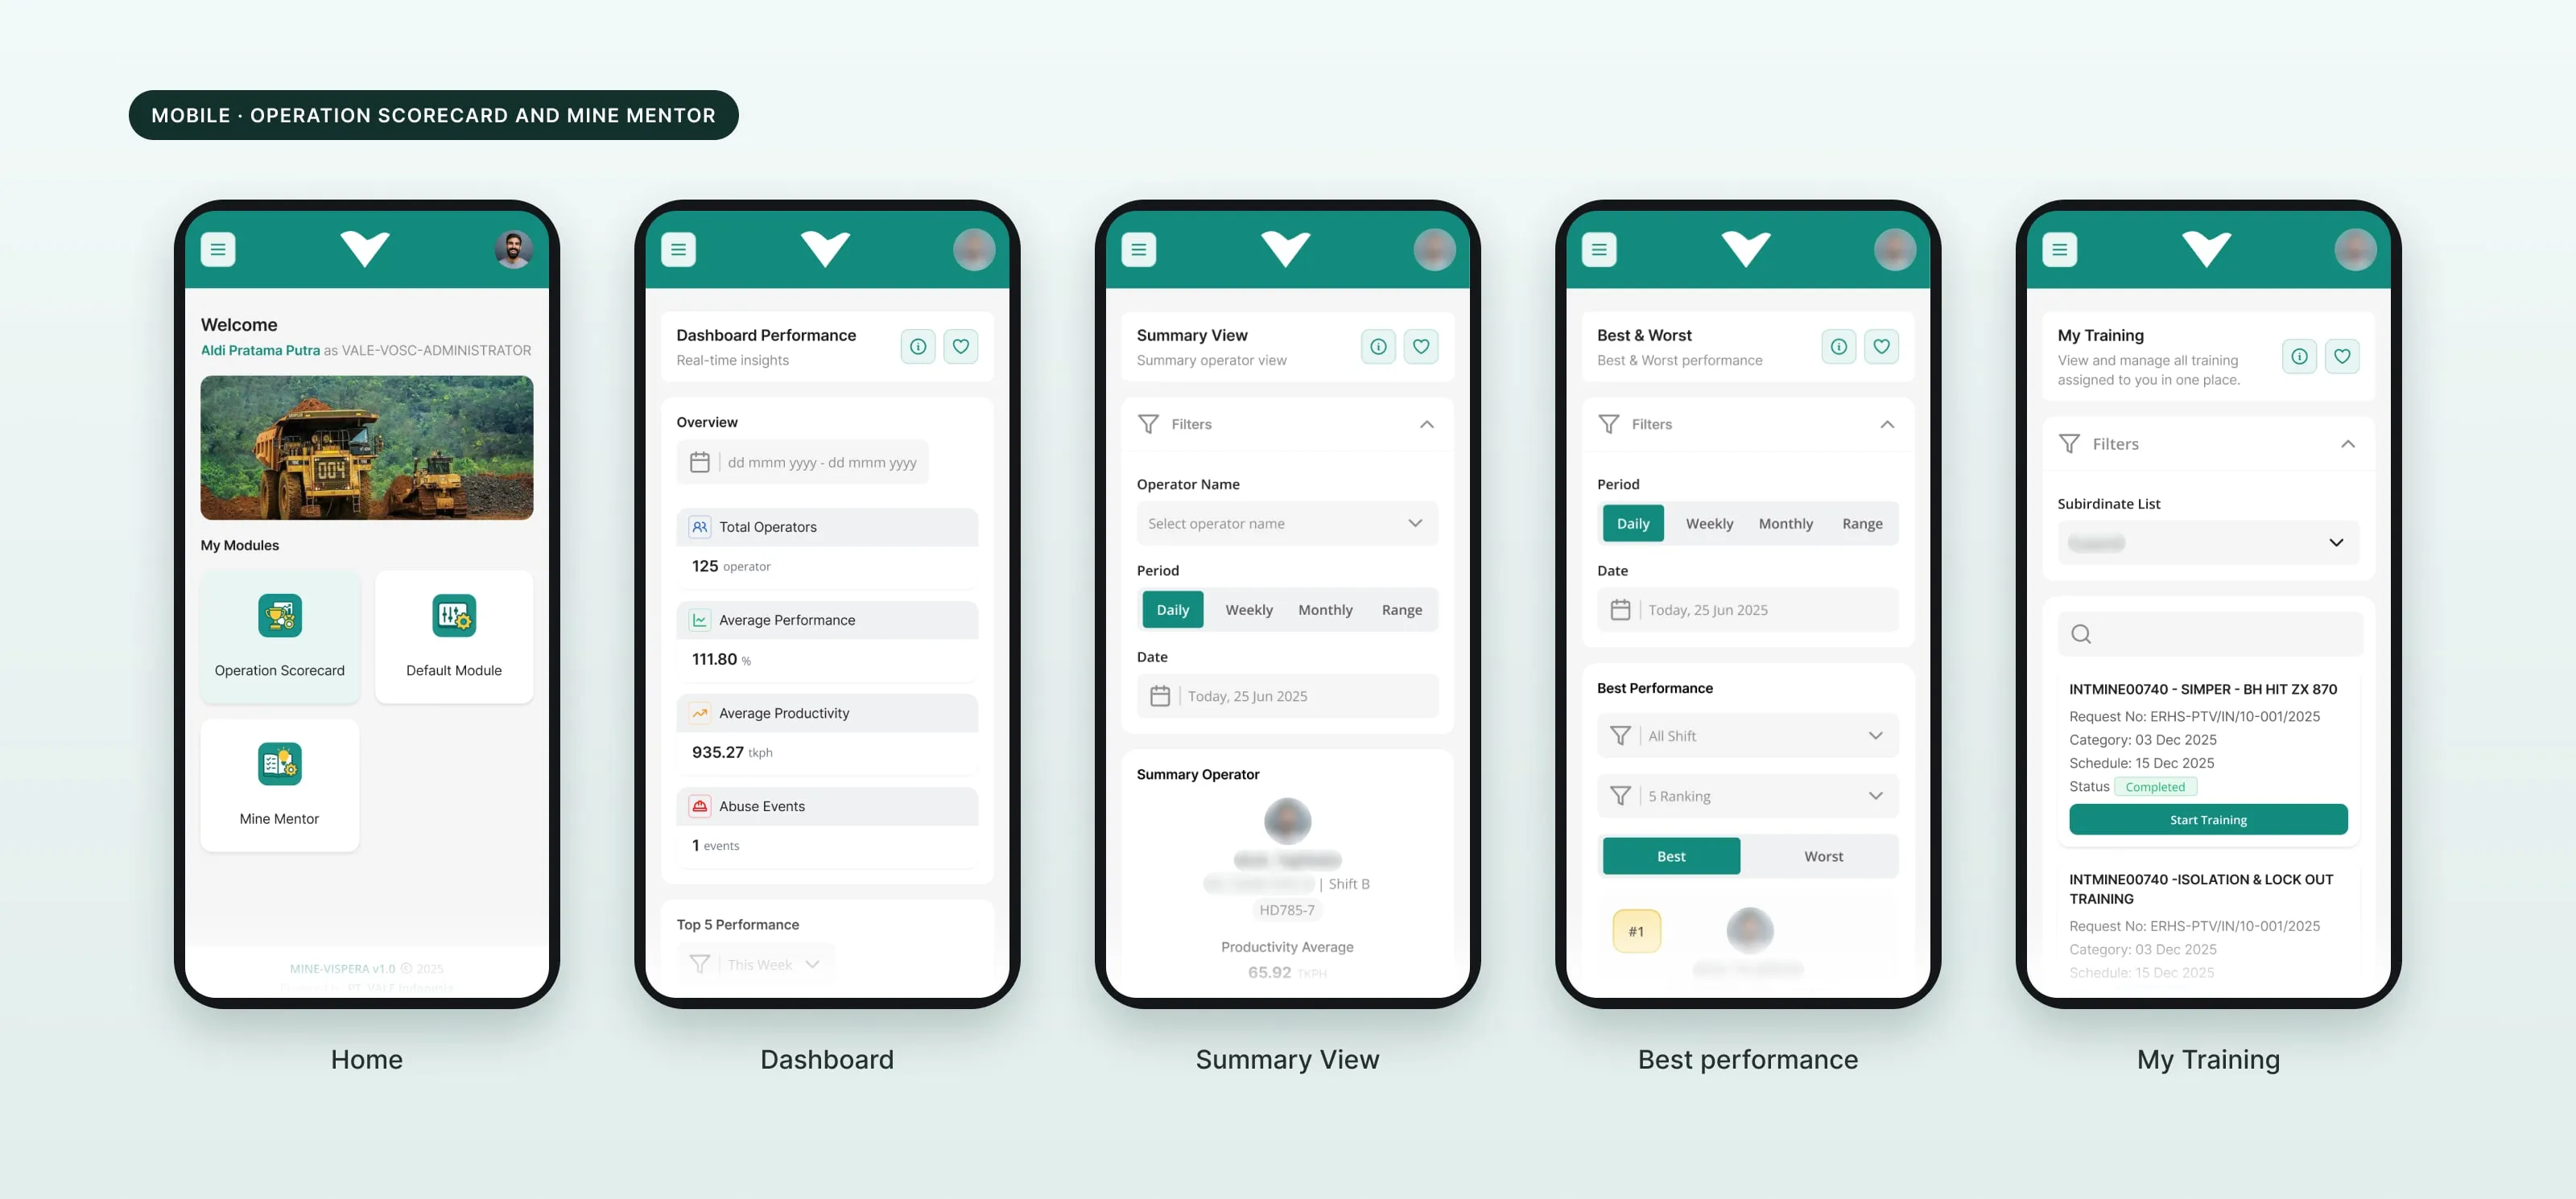
Dashboard, operator ranking, summary view, and best and worst performance. Performance data is grouped so it is easier to compare and read.
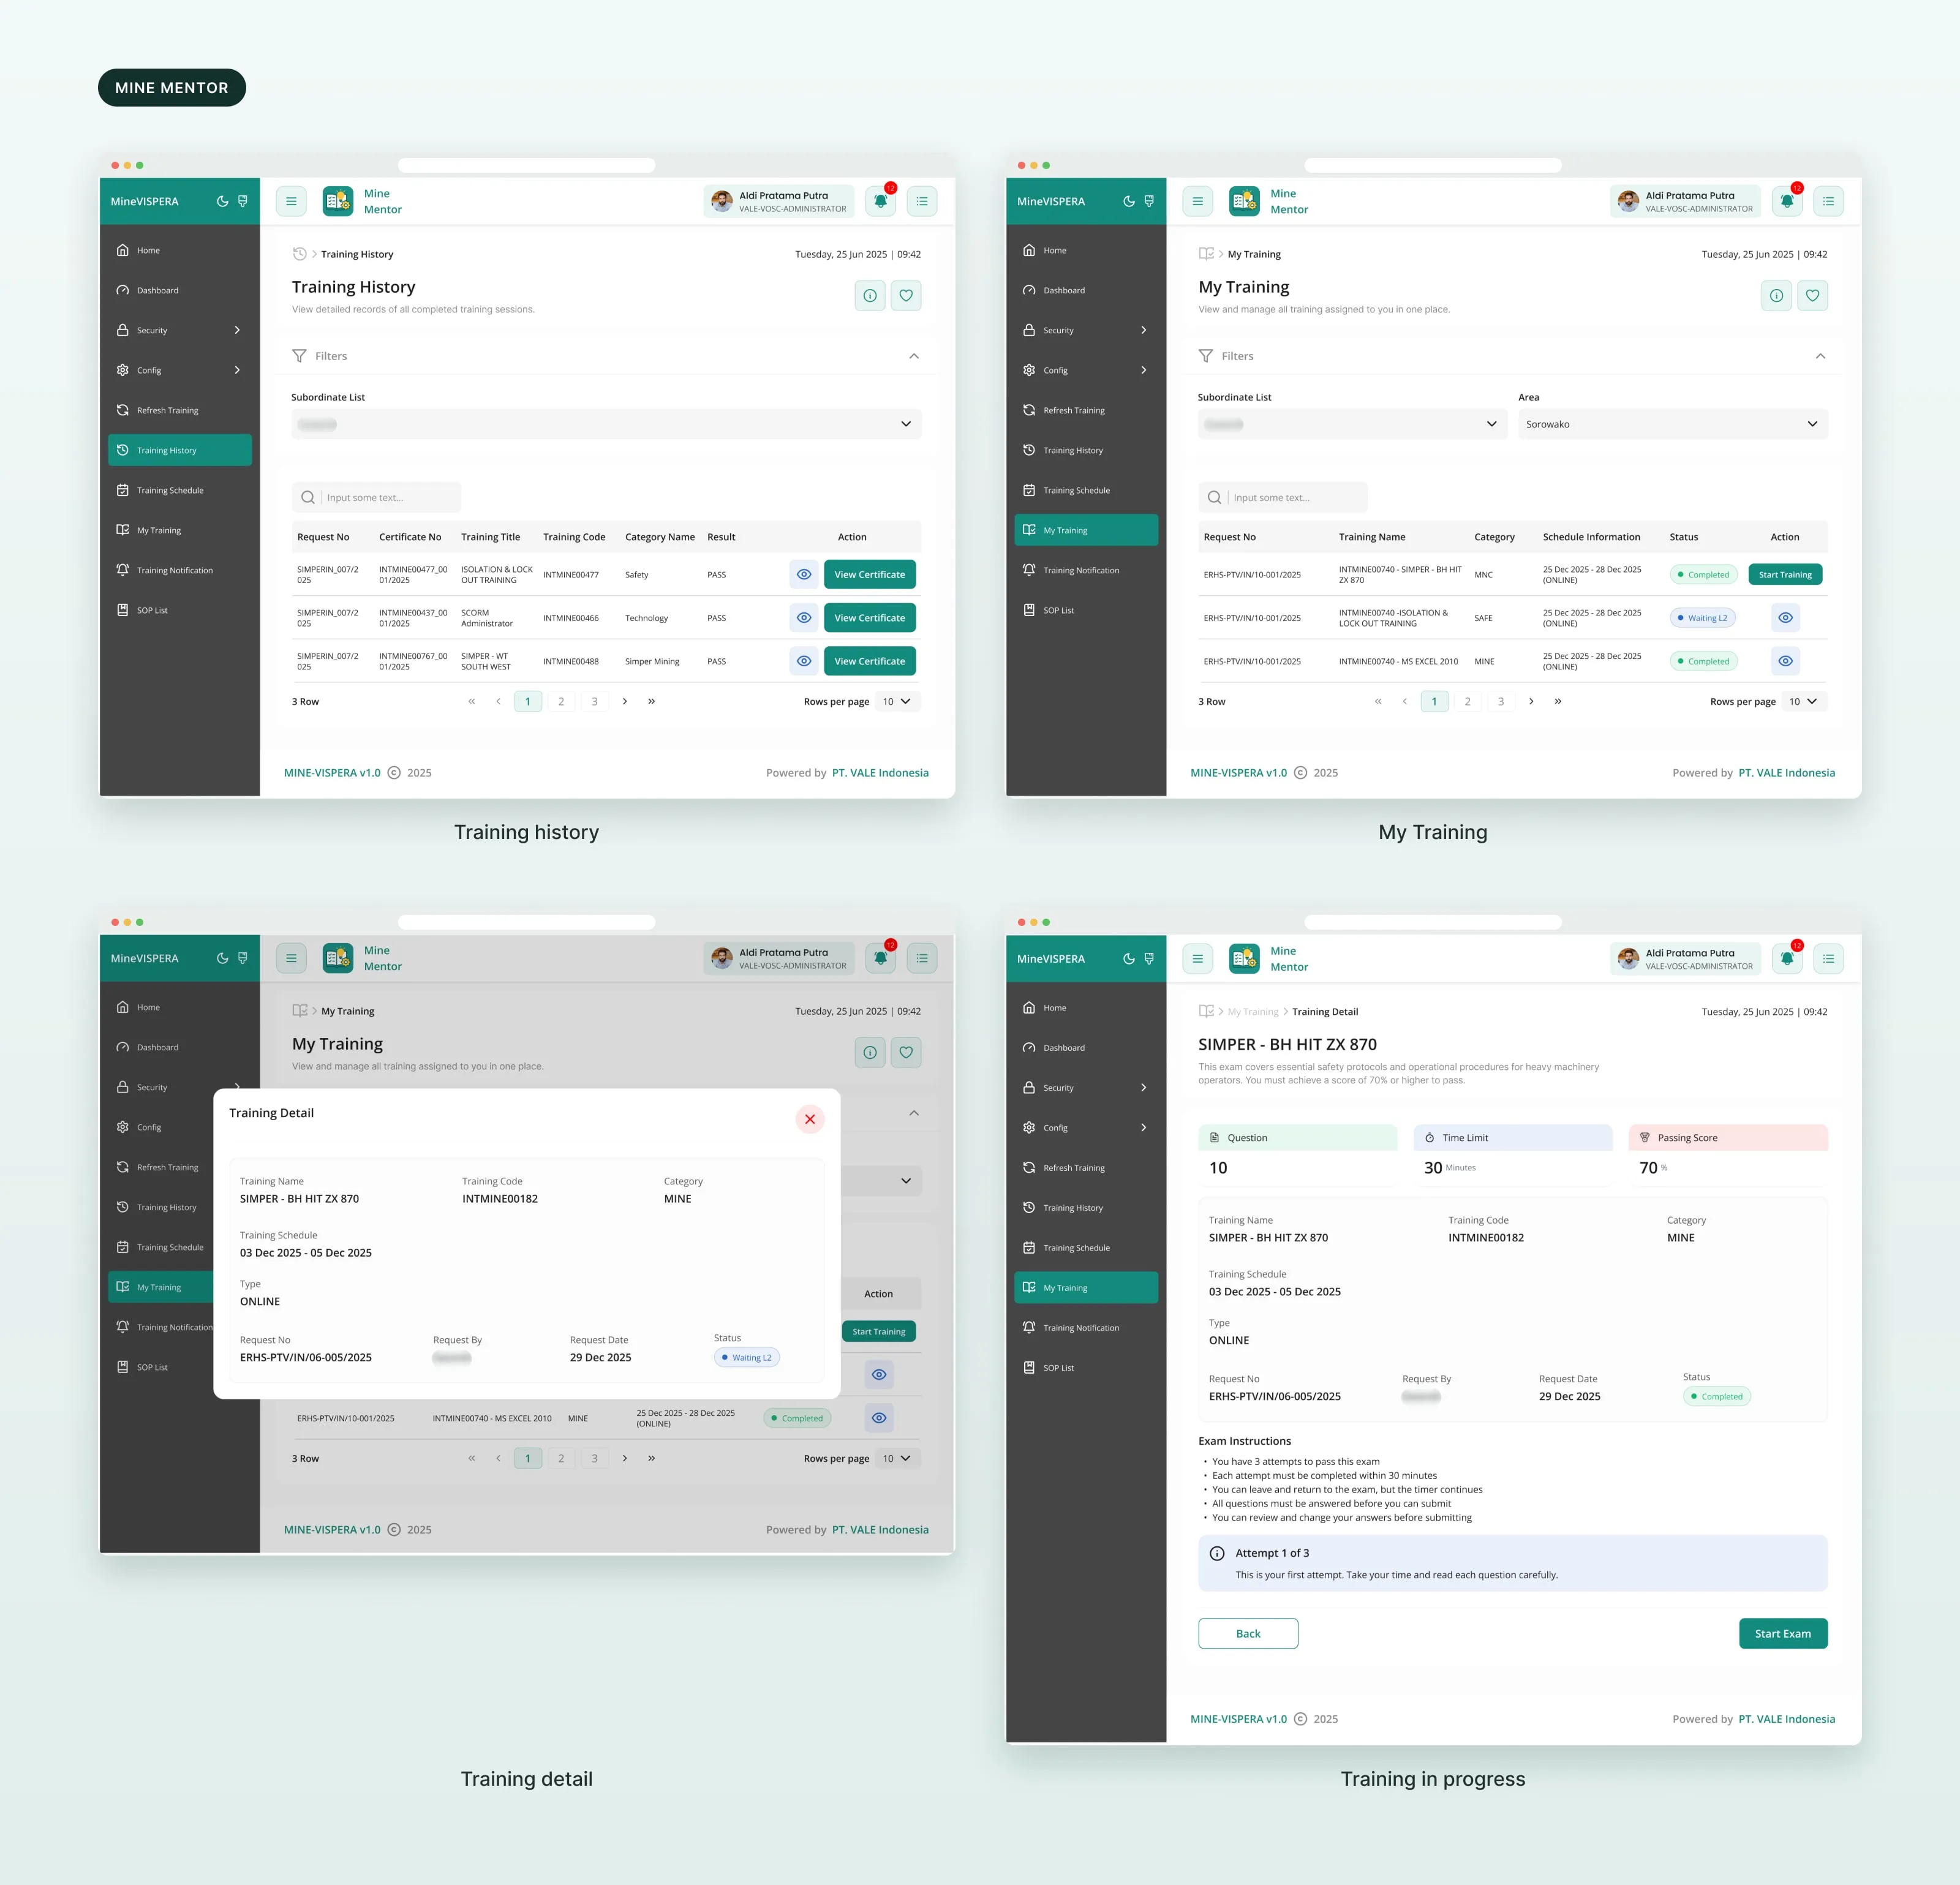
Mine Mentor.
Training information and user progress in a clearer structure: training history, my training, training details and the exam.
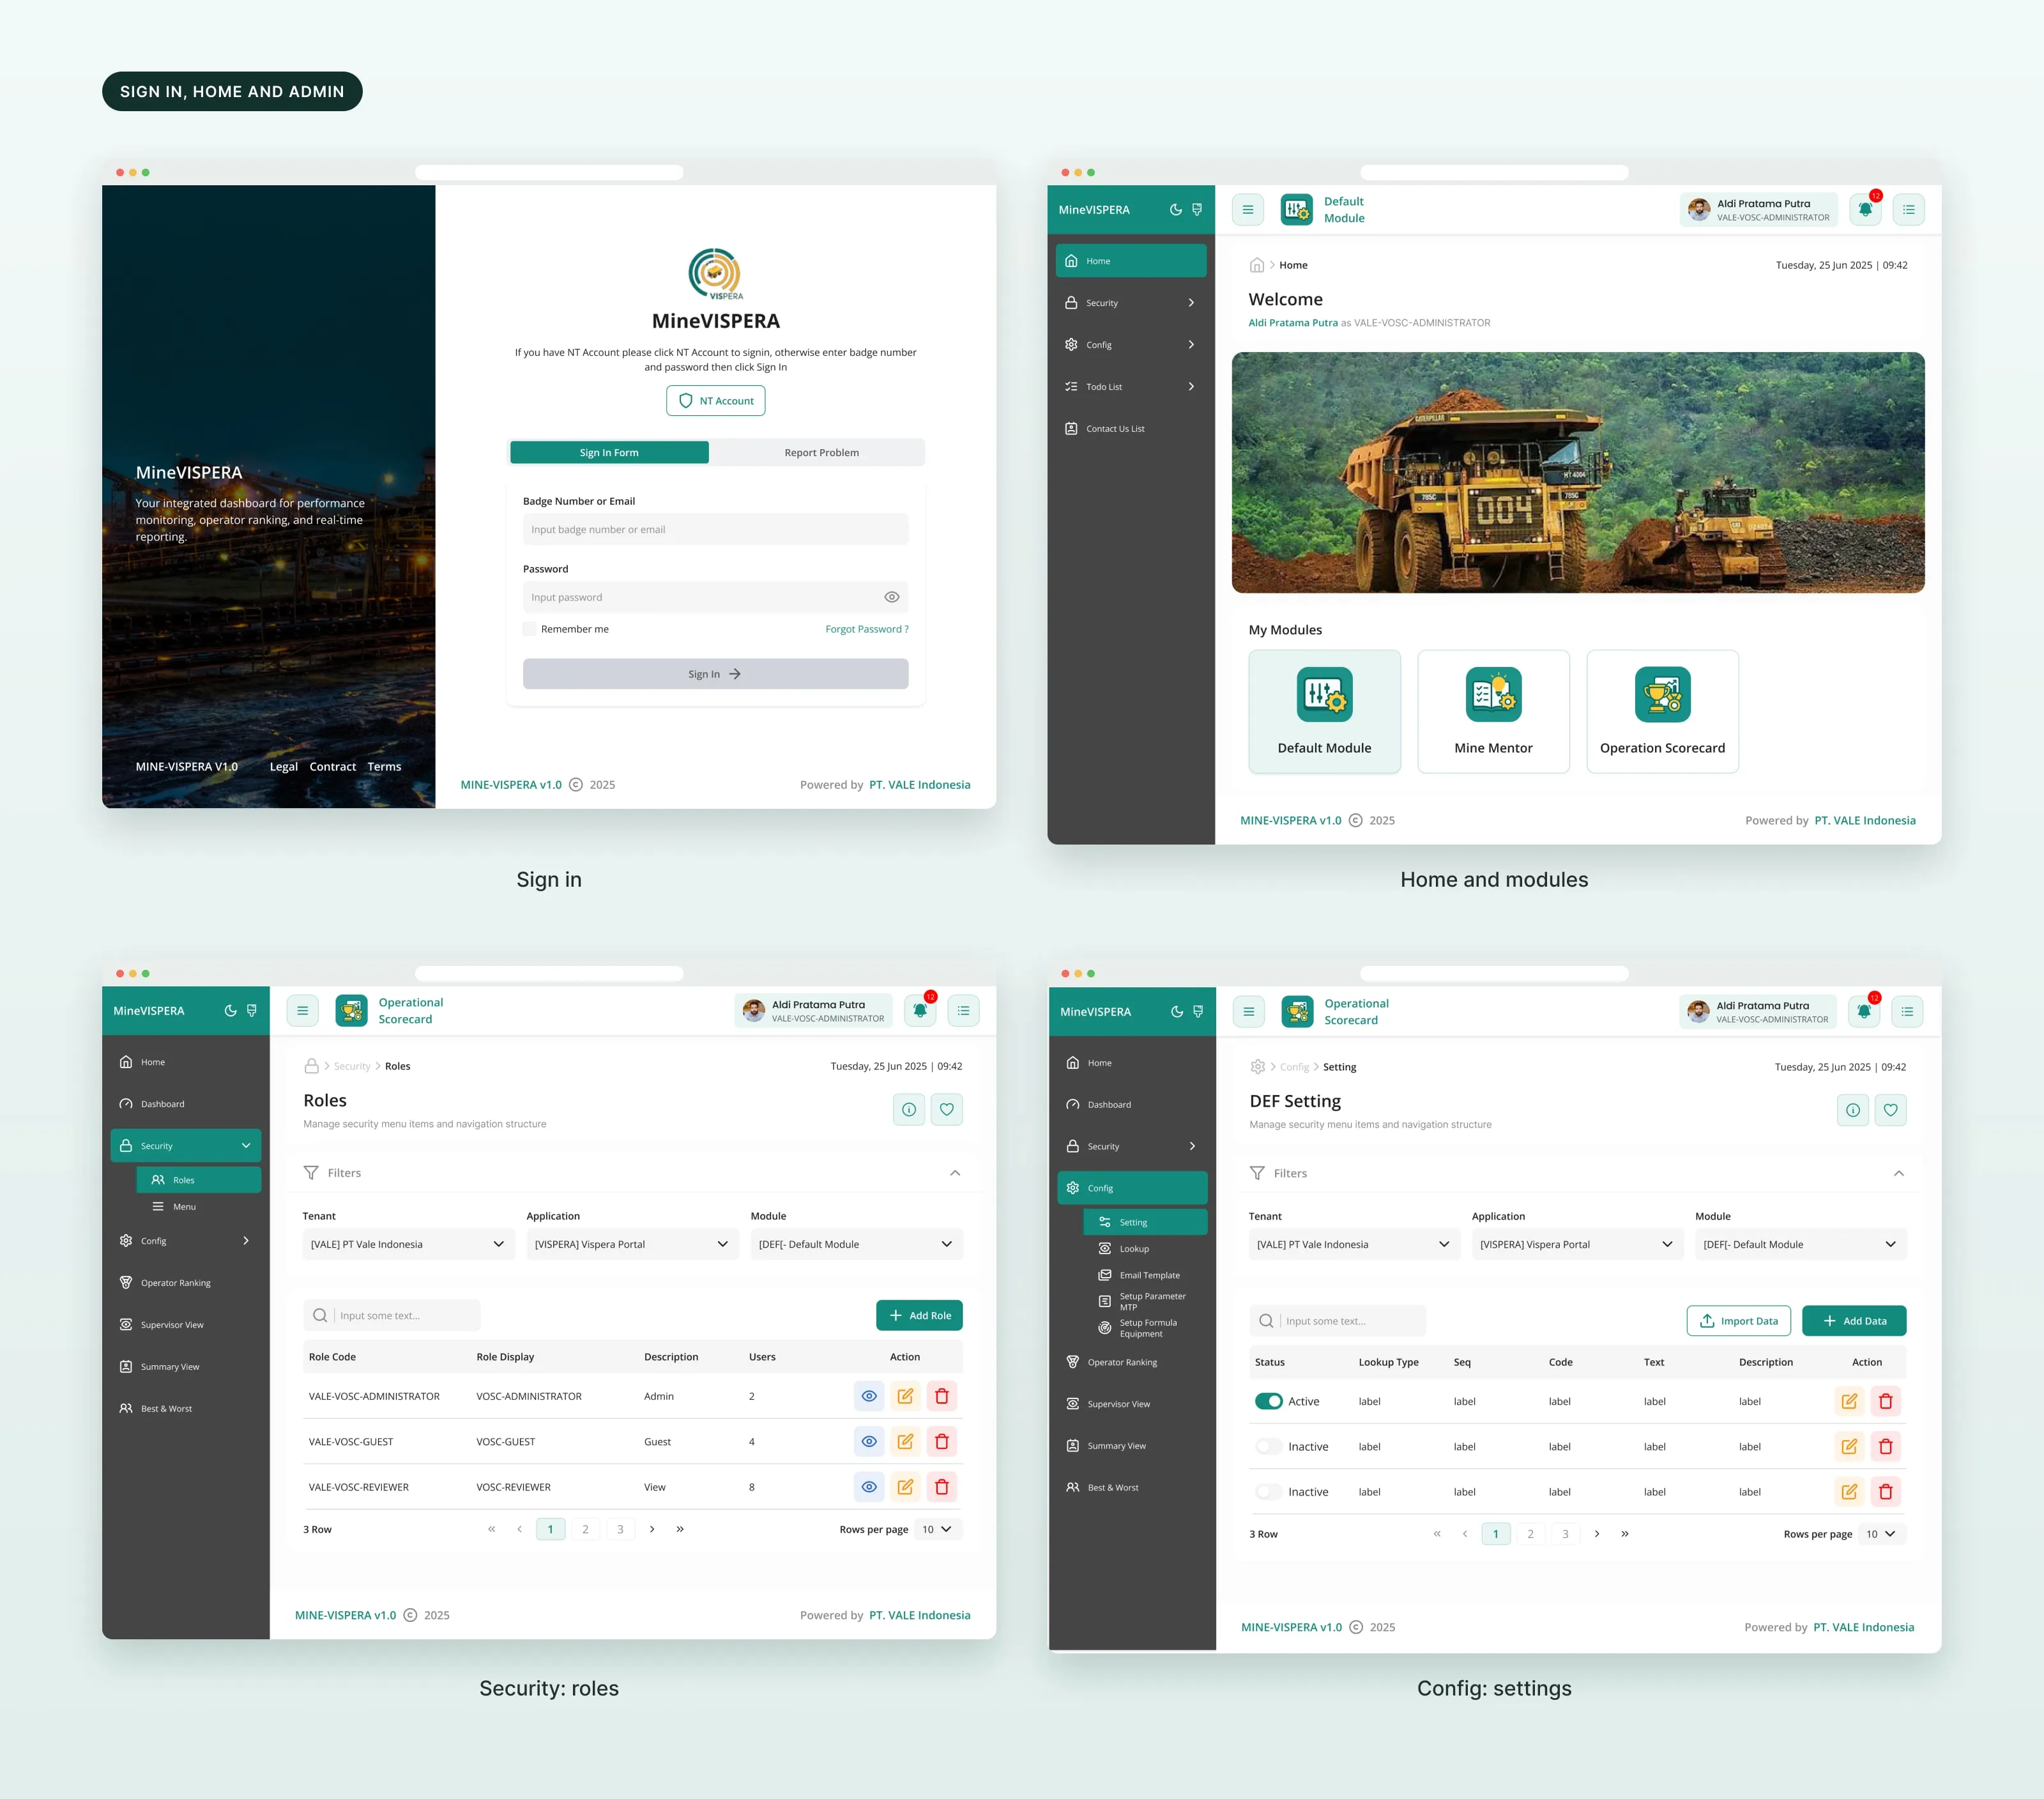
Sign in, home and admin.
People sign in with a badge number or an NT account and confirm with a one-time code. Home shows the modules they can open. Admin pages manage roles, menus and settings.
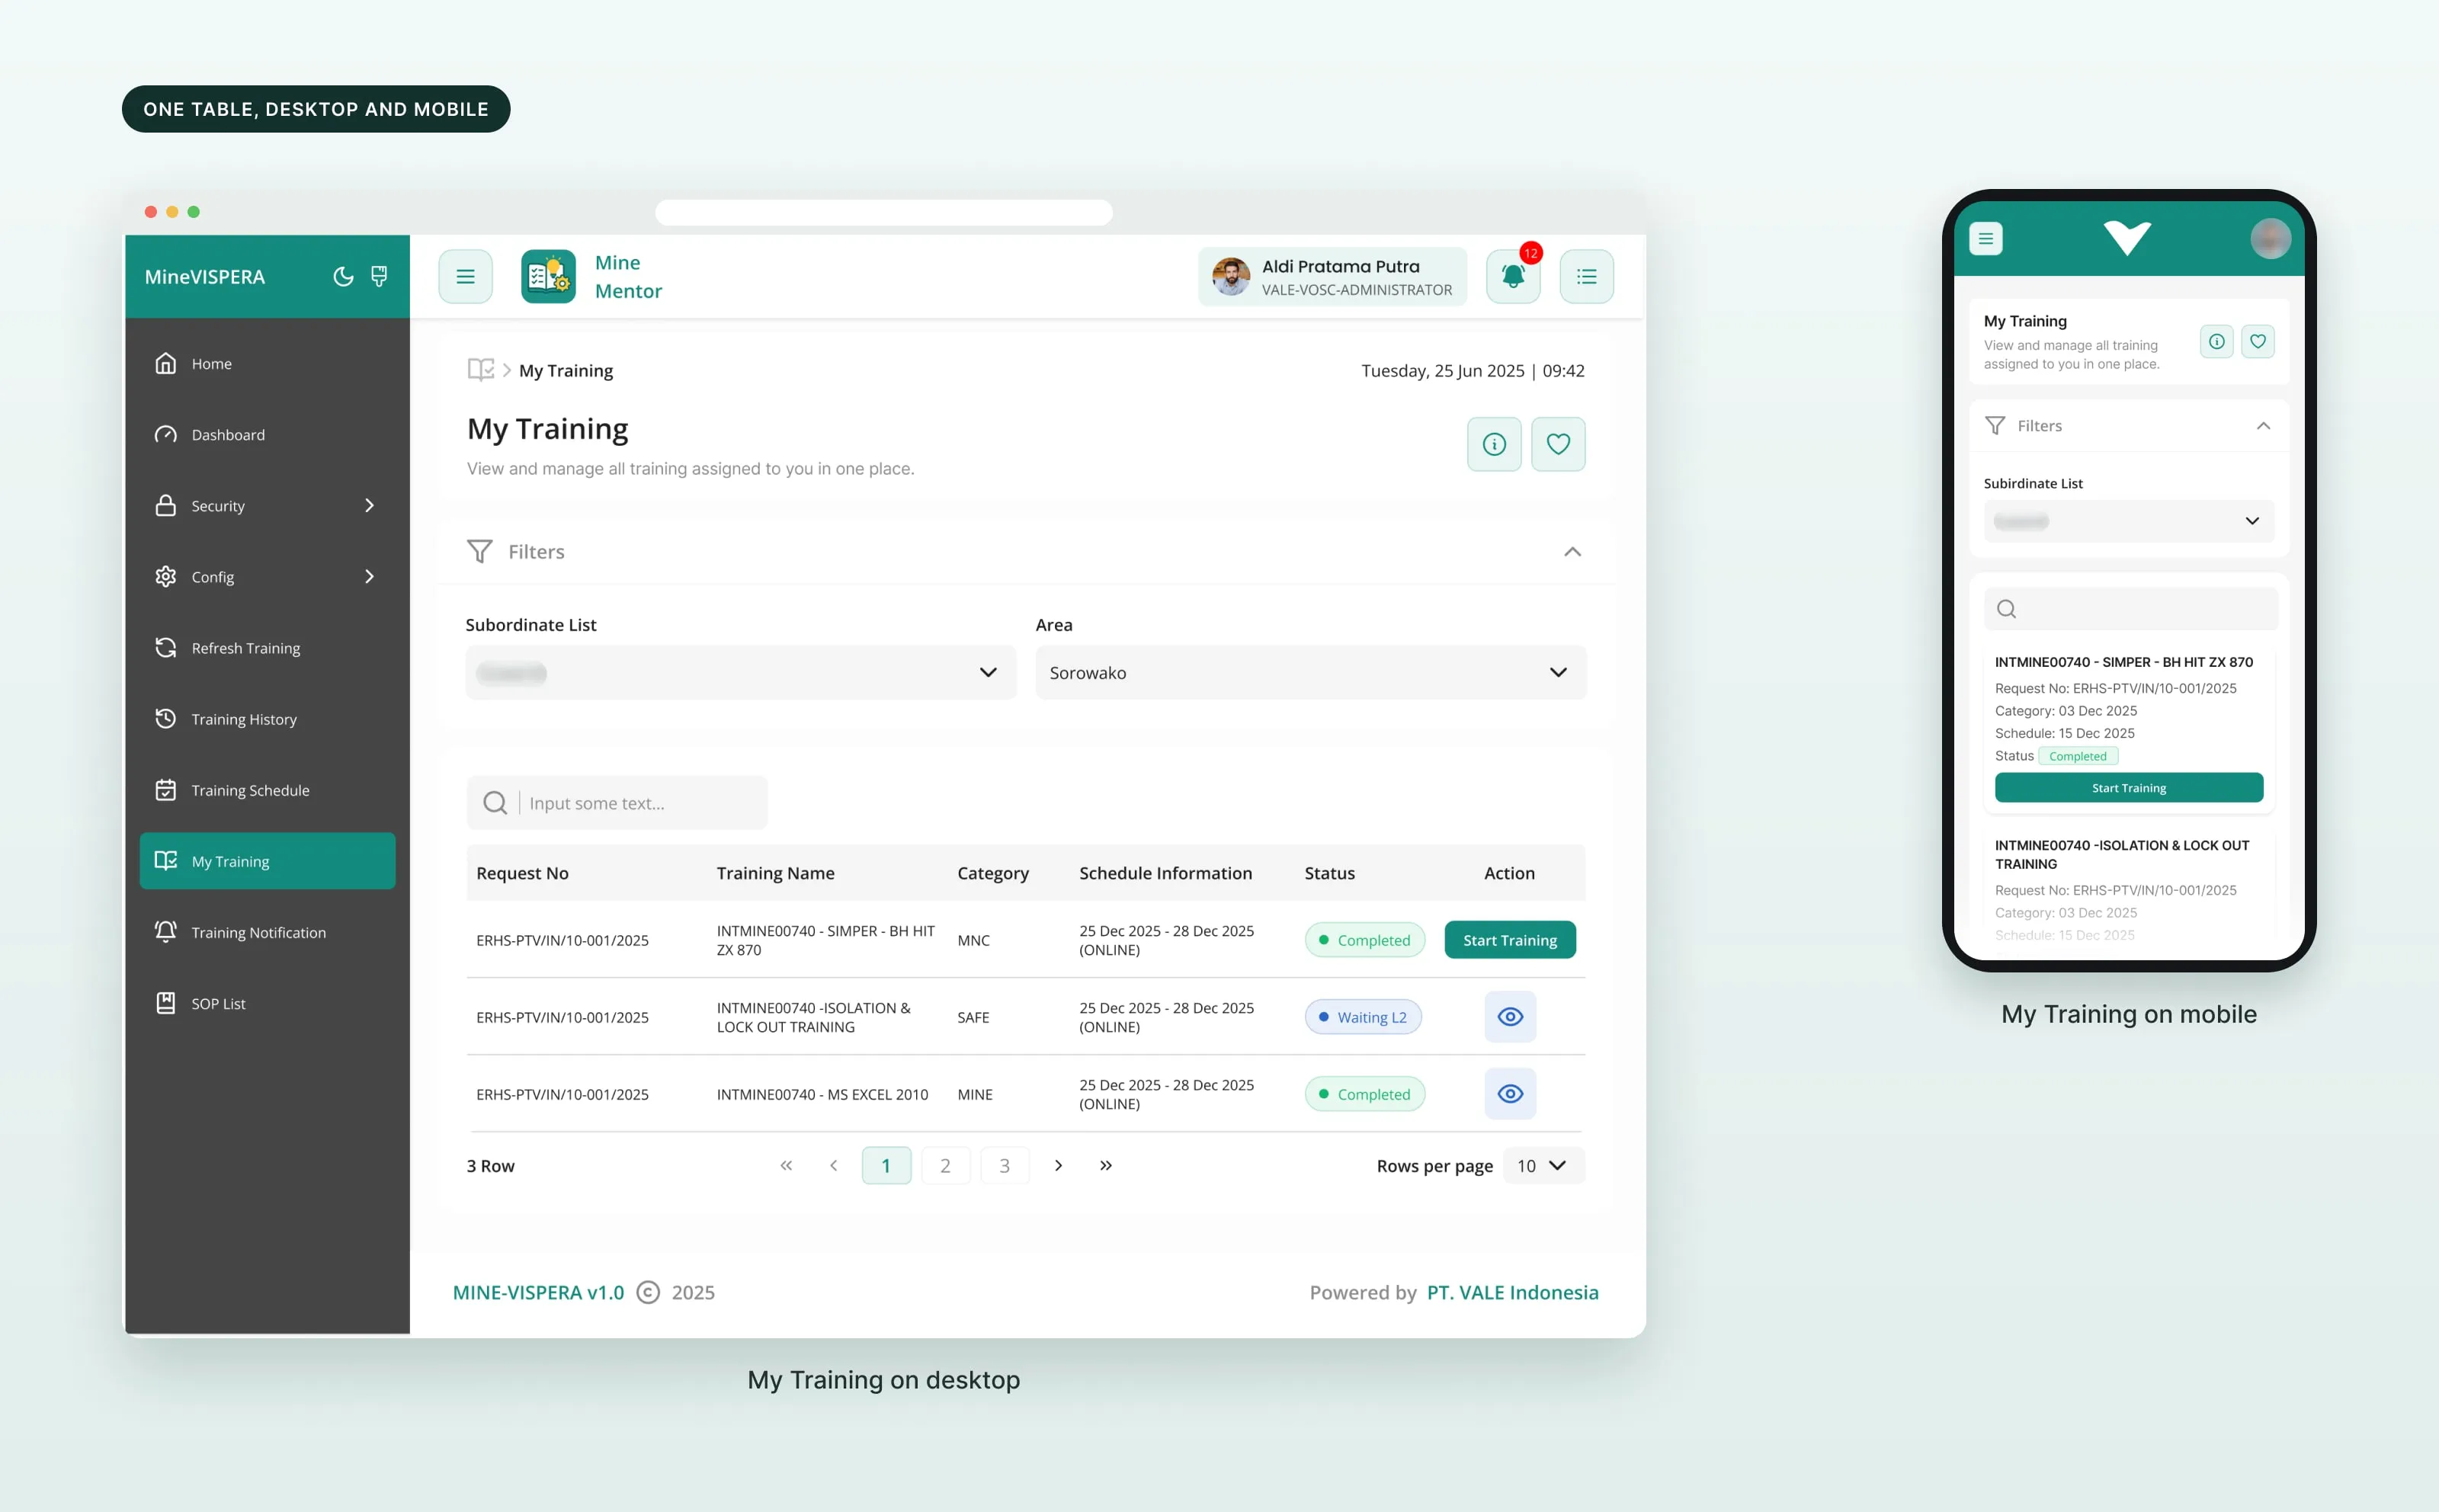
Tables that work on any screen.
On desktop, data sits in tables. On mobile, the same rows become cards. Related data is grouped, states are easier to tell apart, and filters are easier to use.
Desktop and mobile.
Every module has a mobile layout, from the home screen to the scorecard and the training list.
A role-based UI.
The legacy interface became a role-based UI for field users and management users.
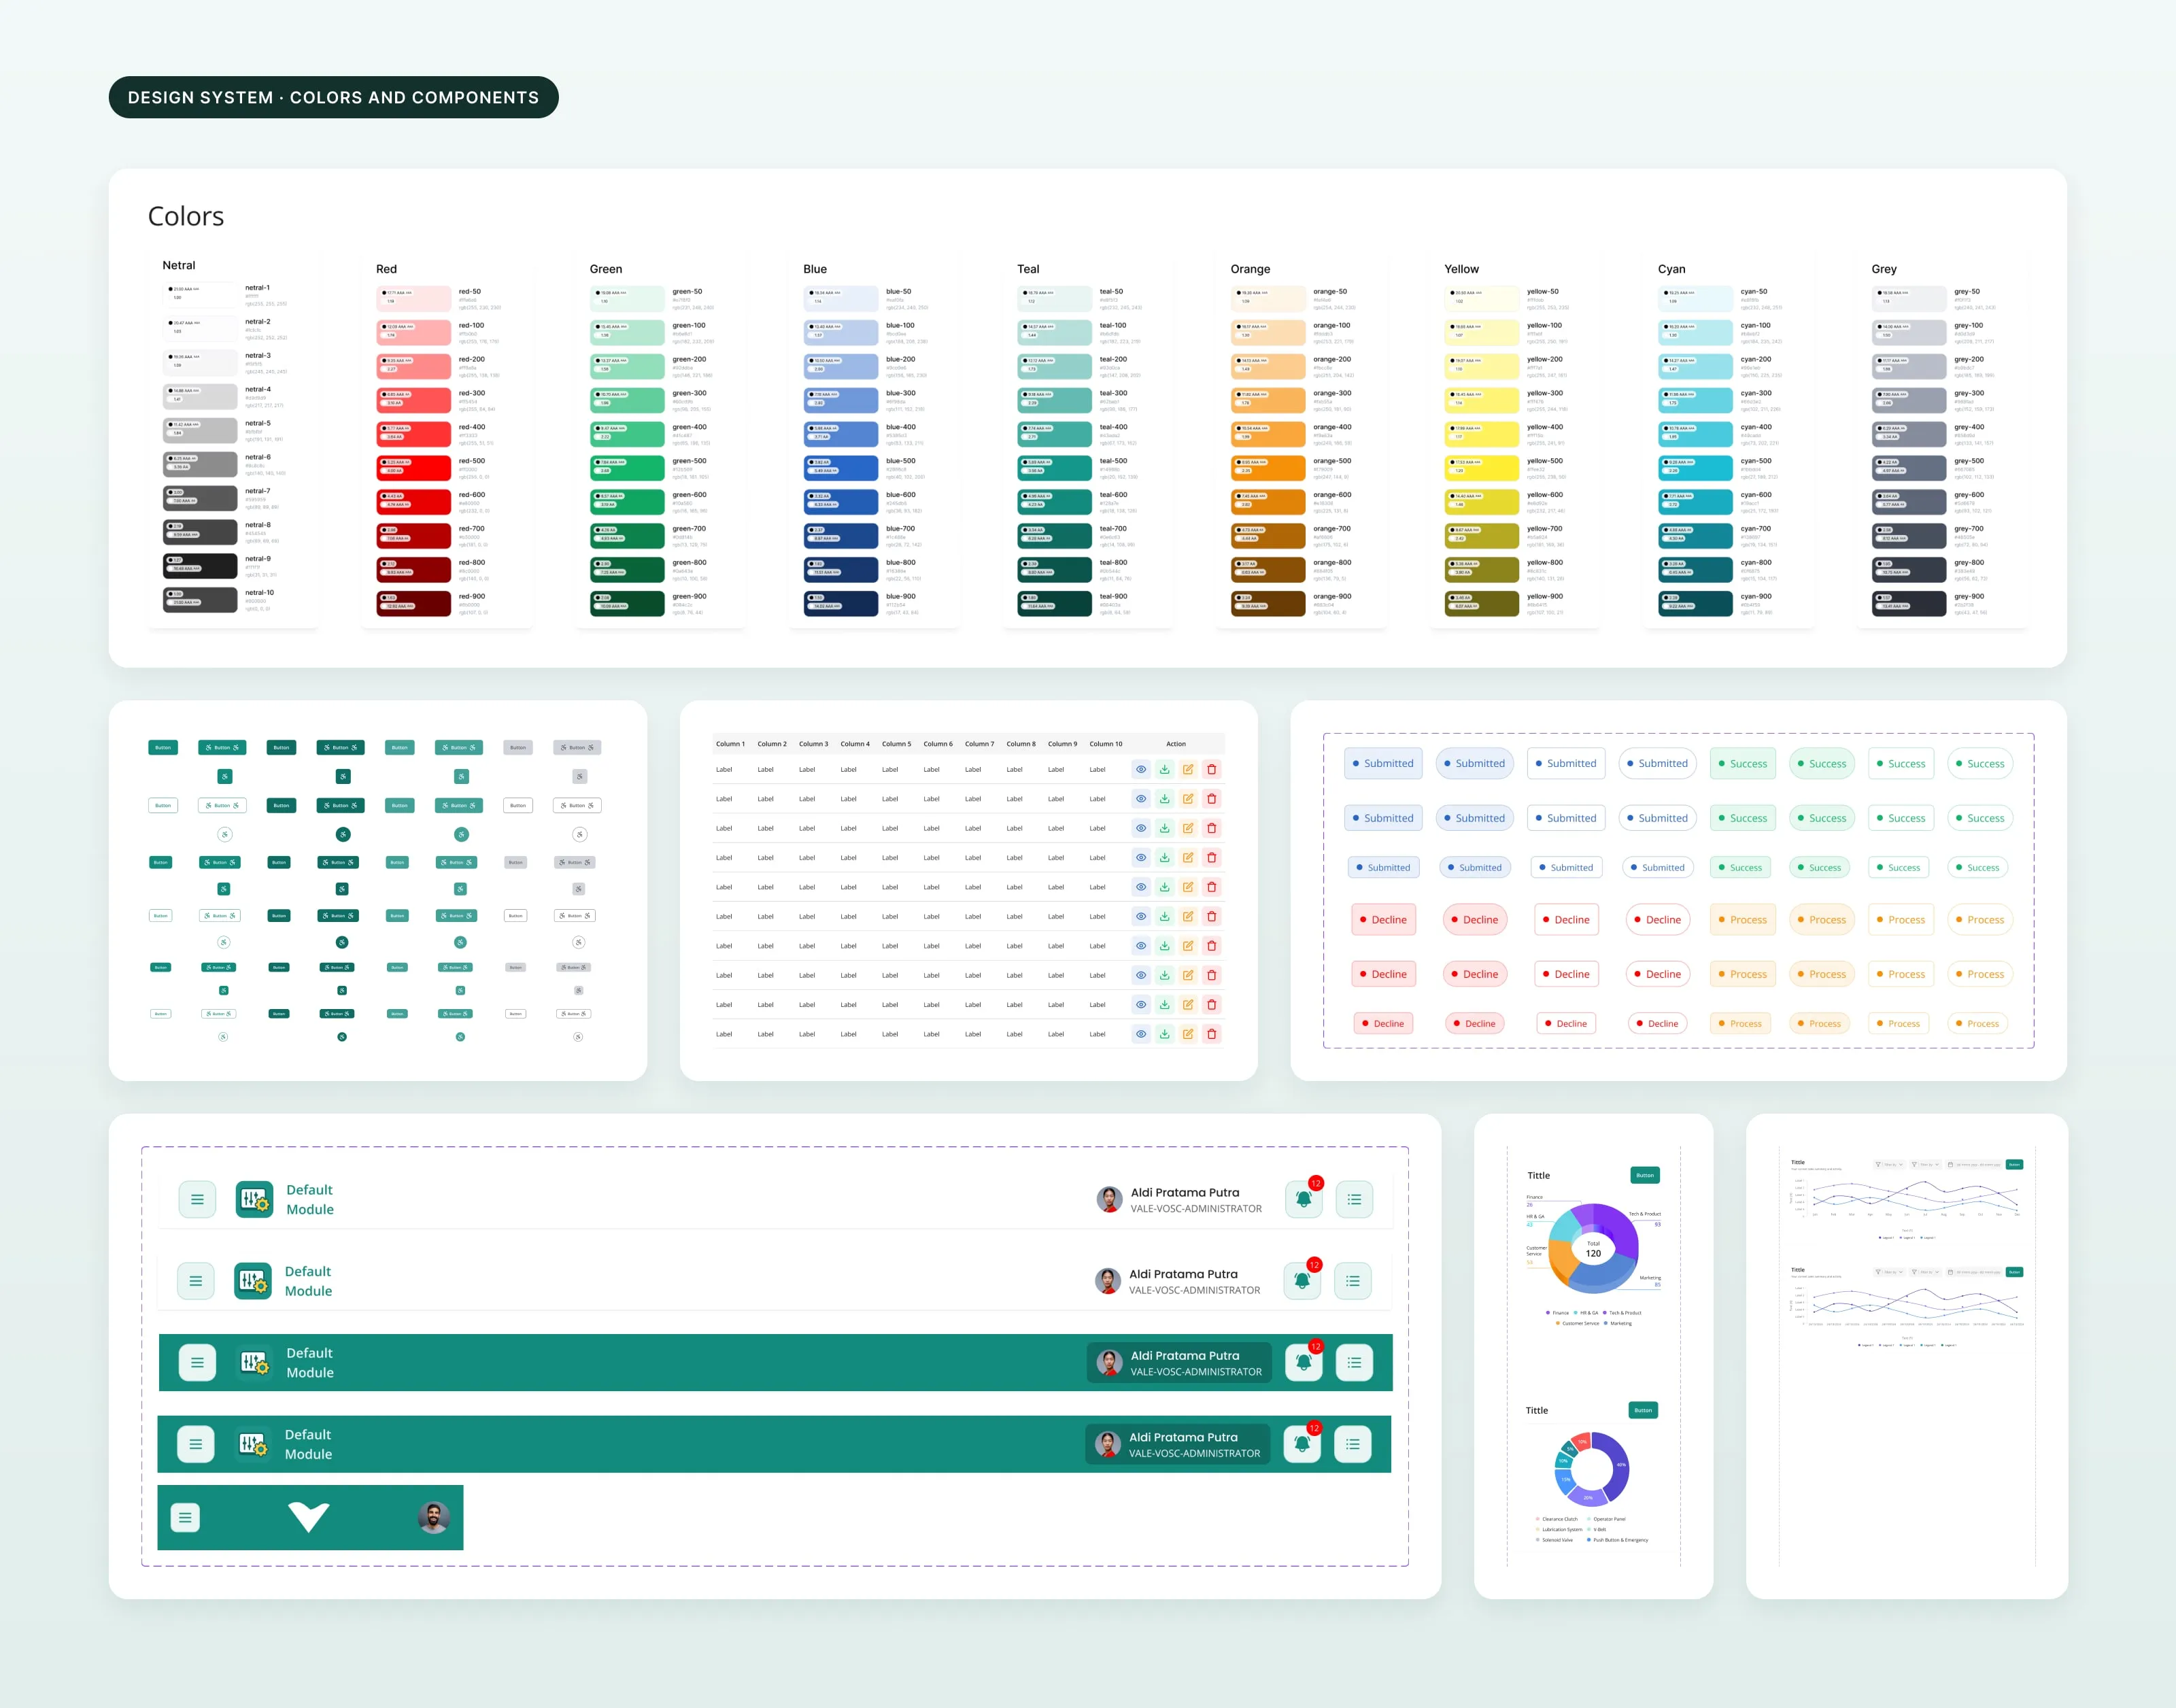
A component library.
Colors, buttons, inputs, tables, status labels, headers, navigation and charts, organized as atoms, molecules and organisms, so the platform behaves as one system.
06 / Result
What I handed over.
3
modules redesigned
~100
screens
1
month
- Prototypes
- Interactive prototypes used in client review and sign-off sessions.
- Handoff
- High-fidelity mockups, component library, UX copy and annotated walkthrough prototypes.
- Platforms
- Layouts for desktop and mobile.
What I took from it
Make complex information easier to read.
Redesigning a complex product is not about making it look simple. It is about making complex tasks easier to finish.